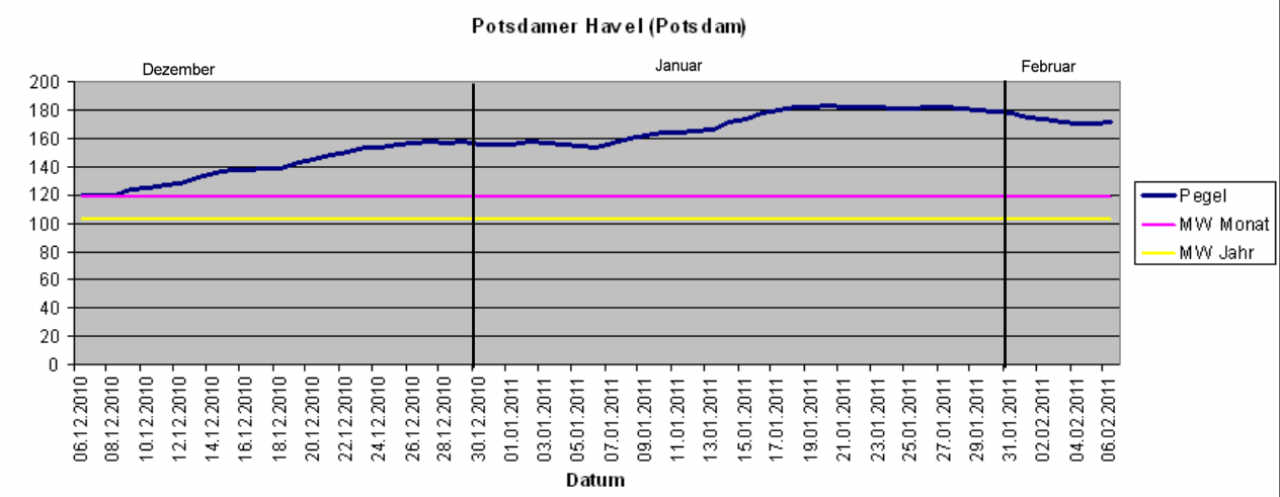
Hier jetzt mal der Pegel als Diagram über 2 Monate

Zum Vergleich noch die Monats- und Jahresmittelwerte in der Tabelle.
This entry was posted on Sonntag, Februar 6th, 2011 at 13:10 and is filed under Uncategorized. You can follow any responses to this entry through the RSS 2.0 feed.
Both comments and pings are currently closed.